 FA
FA
Quick Answer:Measure a GEO campaign with a fixed prompt panel and two primary visibility rates: mention share and citation share. Calculate both by platform, market and intent. Then add recommendation rate, owned-source support, URL coverage, answer accuracy, AI-surface impressions, assistant traffic and pipeline contribution. Present the complete chain without calling contribution automatic attribution.

The measurement gap is the norm, not the exception
Start with the honest baseline. In a Semrush survey of 481 marketers, 45 percent of marketing leaders could not accurately measure brand visibility in AI-generated answers, and only 9 percent reported having tools to track all relevant metrics across platforms. The same companion survey found that 81 percent of organizations integrating SEO and AI visibility reported increased AI traffic or leads, compared with 36 percent managing them separately. That is a self-reported association, not proof that integration caused the difference.
Why did the old scoreboard stop working? Because the metrics your dashboards default to, rankings, sessions, click-through, describe a click economy that AI answers are dismantling. Pew Research Center's tracked-browsing study found users click a traditional result in just 8 percent of Google searches that show an AI summary, versus 15 percent without one, and click the sources inside the summary on about 1 percent of visits. A GEO campaign judged purely on clicks will look like a failure even while it's winning, which is the argument I laid out in The Zero-Click Economy.
When an AI summary appears, the click disappears
Click behavior on Google searches, tracked-browsing panel
The two KPIs that are the scoreboard
- Mention share = valid responses that name the brand ÷ all valid responses × 100.
- Citation share = valid responses that cite the tracked domain ÷ all valid responses × 100.
These are observed presence rates. A mention does not prove that a model “knows” the brand, and a citation does not prove “trust.” Those metaphors are useful in a presentation, but the dashboard should record only what happened.
A worked example
Suppose ChatGPT returns 20 valid answers for a fixed B2B software panel. The brand appears in 8 and its domain is cited in 3. Mention share is 8 ÷ 20 = 40%. Citation share is 3 ÷ 20 = 15%. Report both with the denominator, date, market, language, account state and model or product used. With a small sample, treat movement as directional until repeated observations support it.
A mention, a citation and a retrieved URL are not the same thing
GEO reports often merge signals that answer different questions. Apply this taxonomy before building a chart:
| Signal | What you can claim | What it does not prove |
|---|---|---|
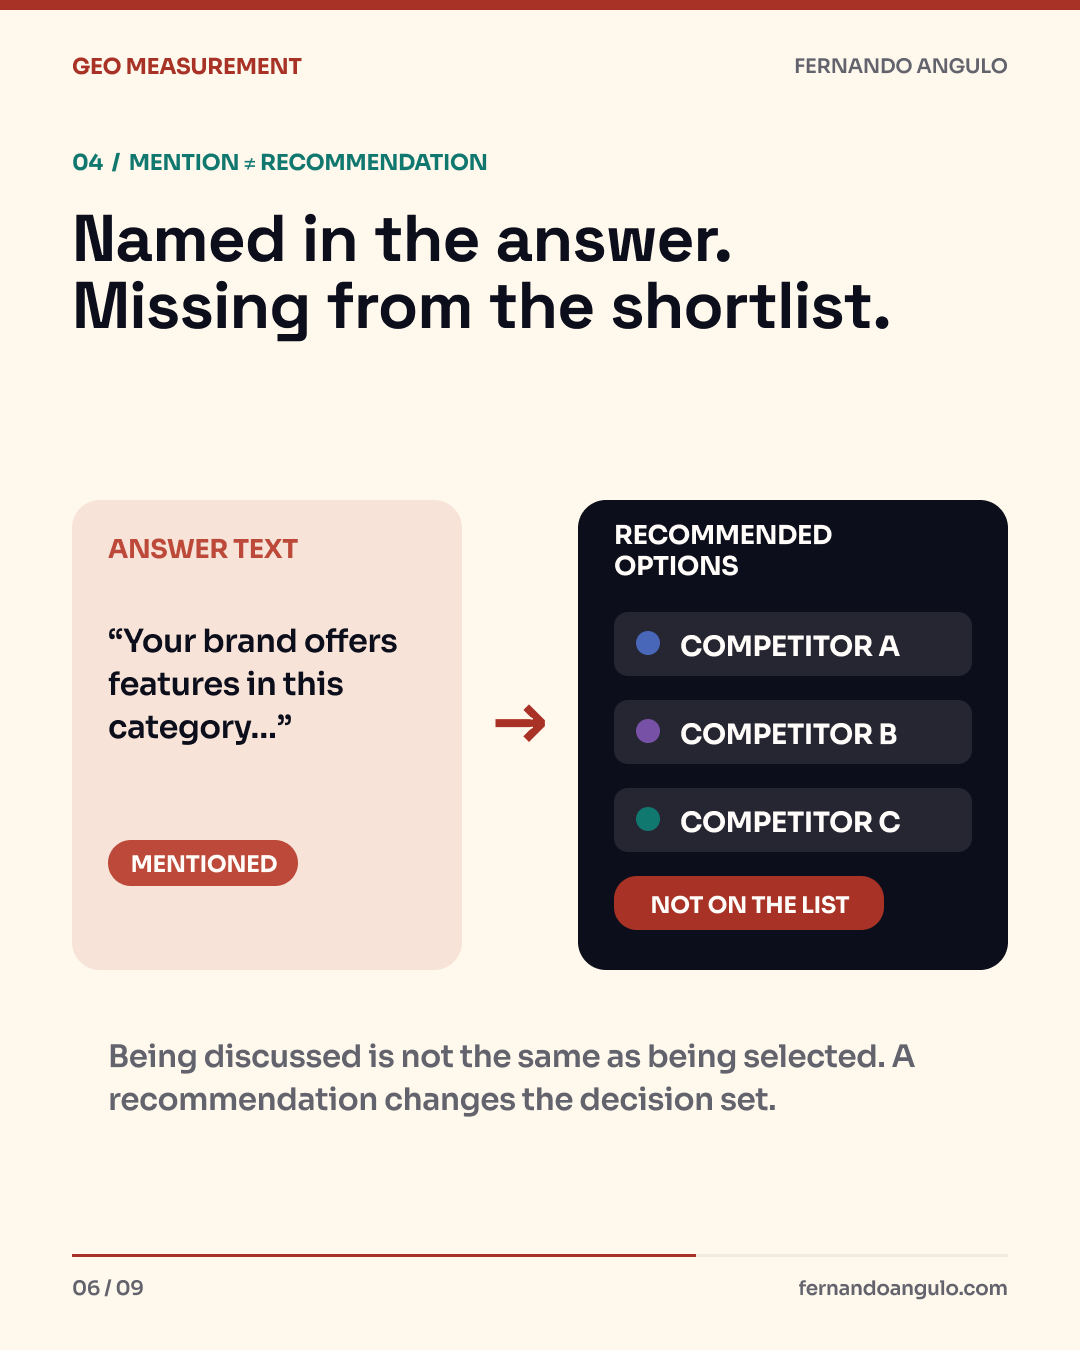
| Mention | The answer names the brand. | That it recommends the brand or uses an owned source. |
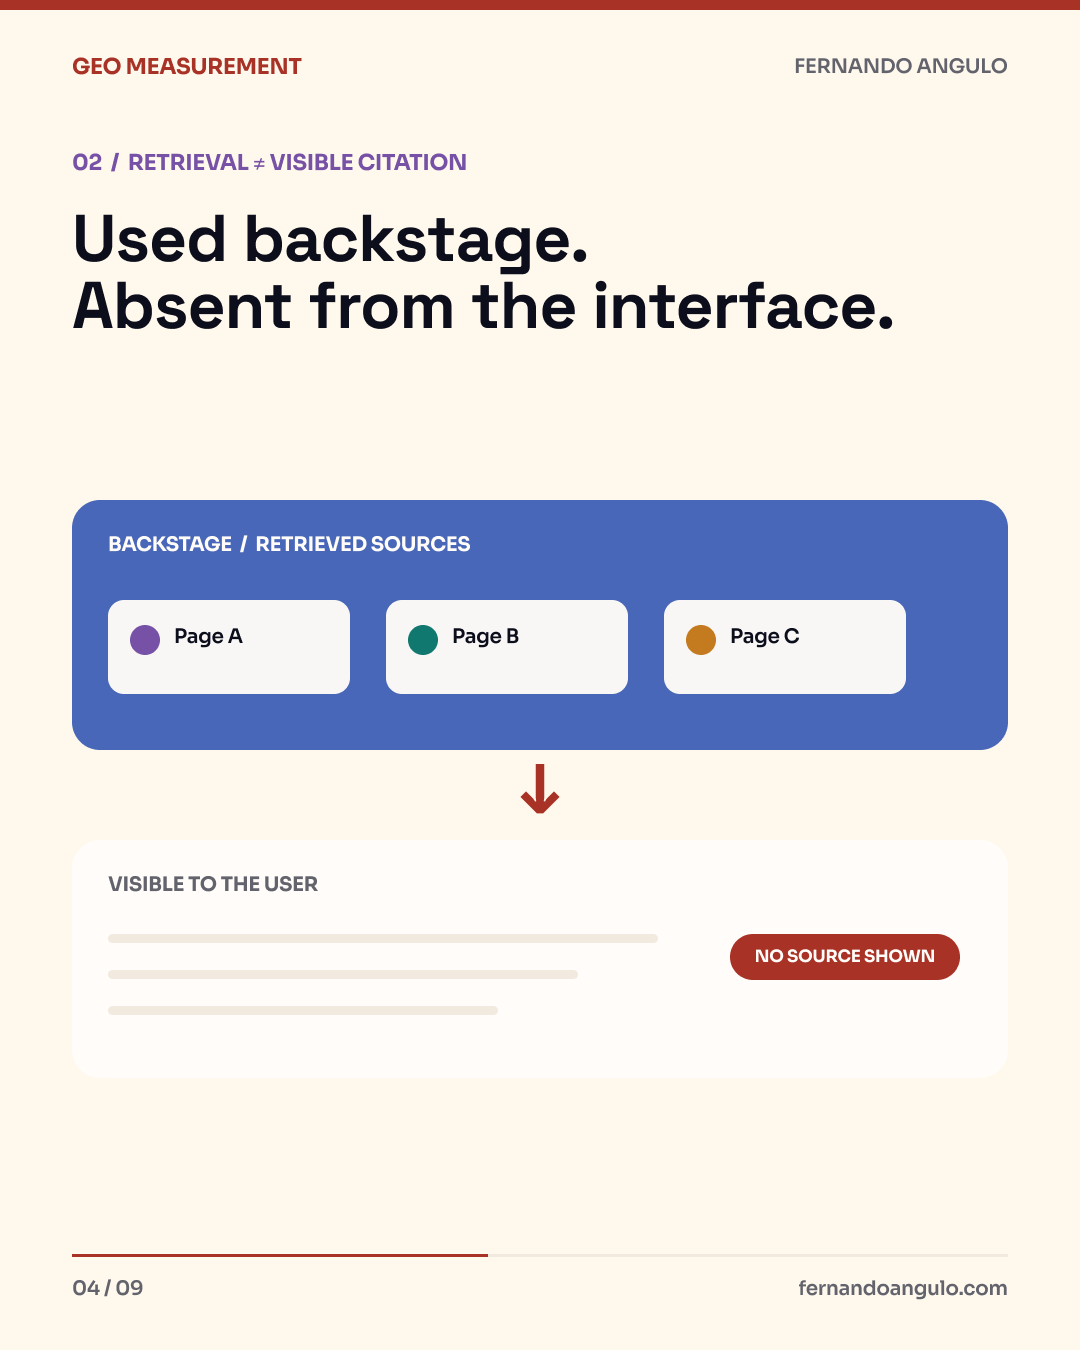
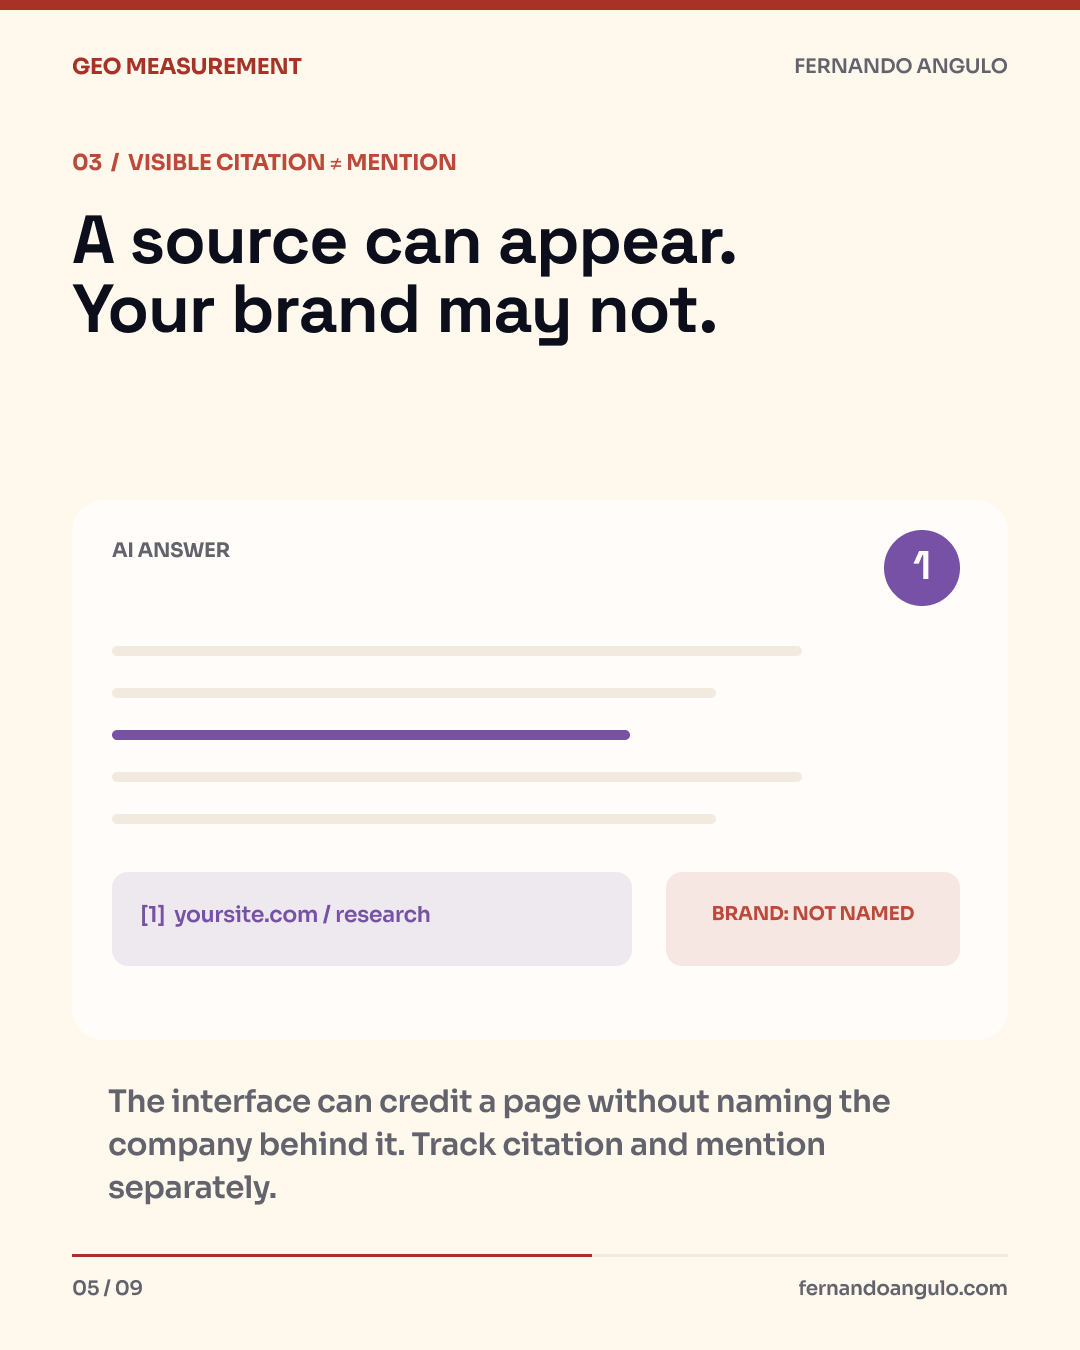
| Visible citation | The interface displays a reference or link associated with the answer. | That the brand appears in the text or that a user clicked. |
| Related link | The URL appears in a sources panel or related results. | That it supports a specific claim. |
| Retrieved URL | The system used the URL during internal search or retrieval, if the platform or tool exposes that trace. | That the URL was visible to the user. |
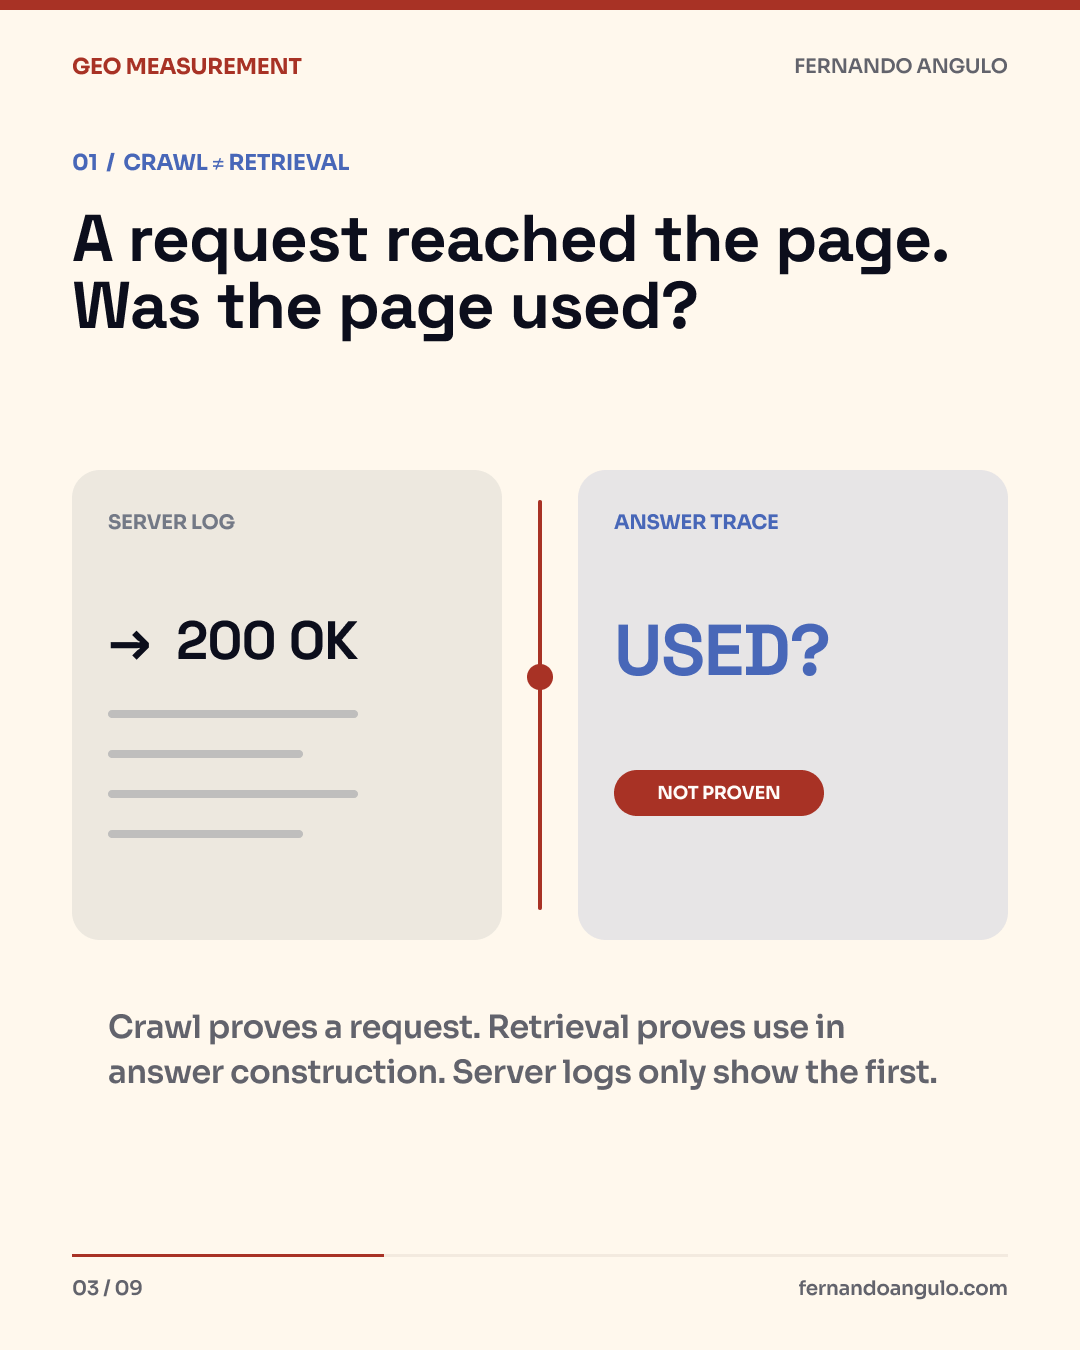
| Crawled URL | A bot requested the page according to server logs. | That the page was retrieved, cited or used in an answer. |
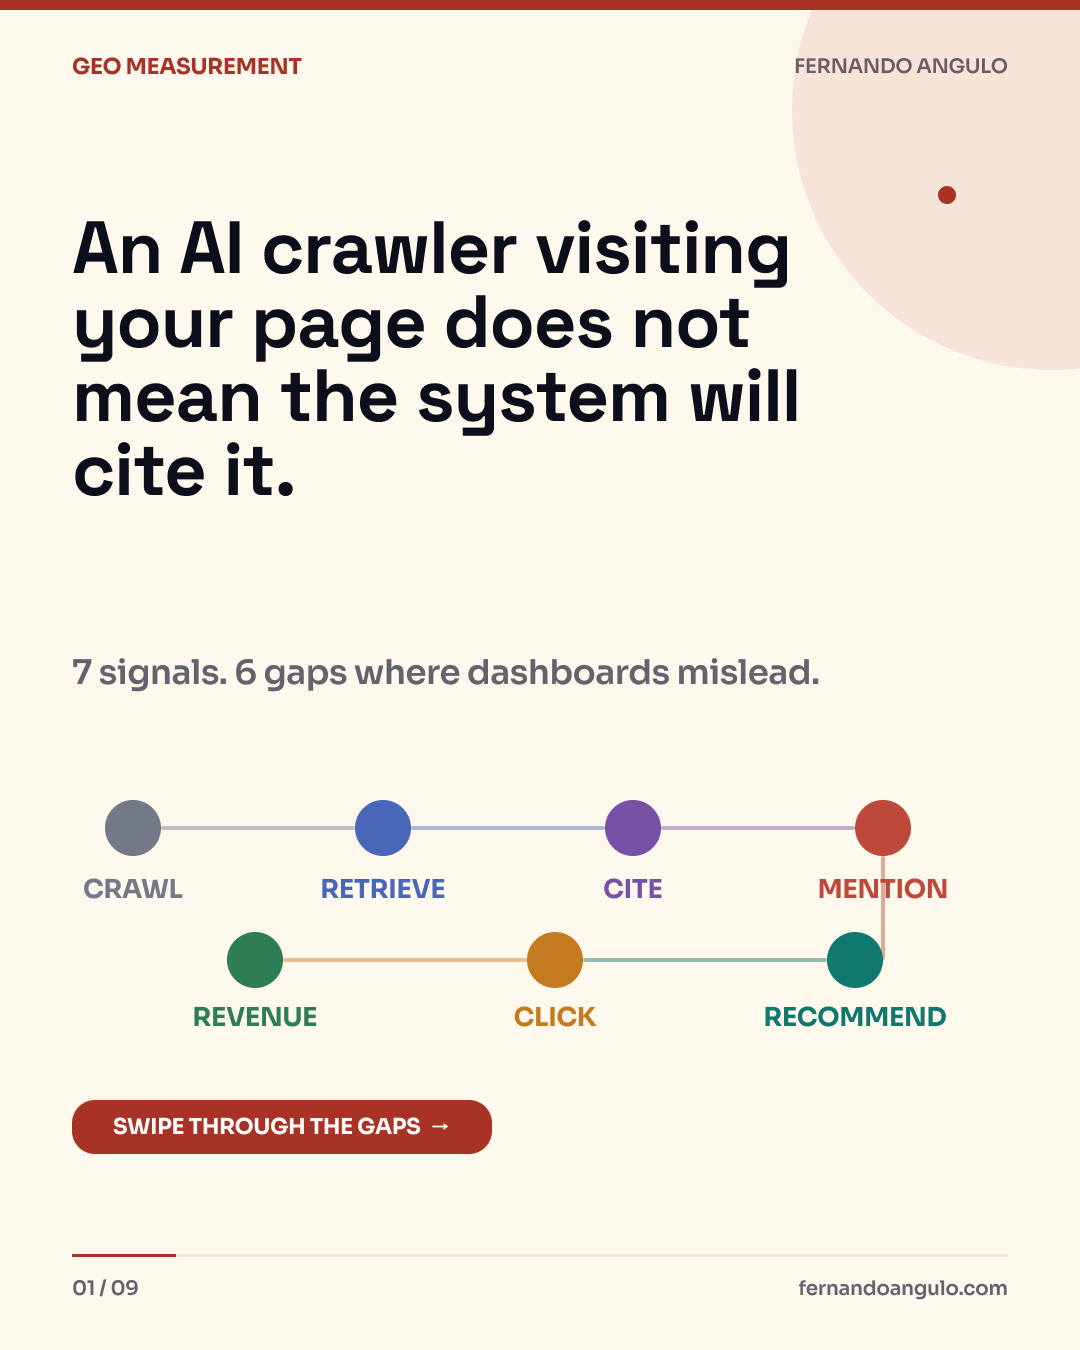
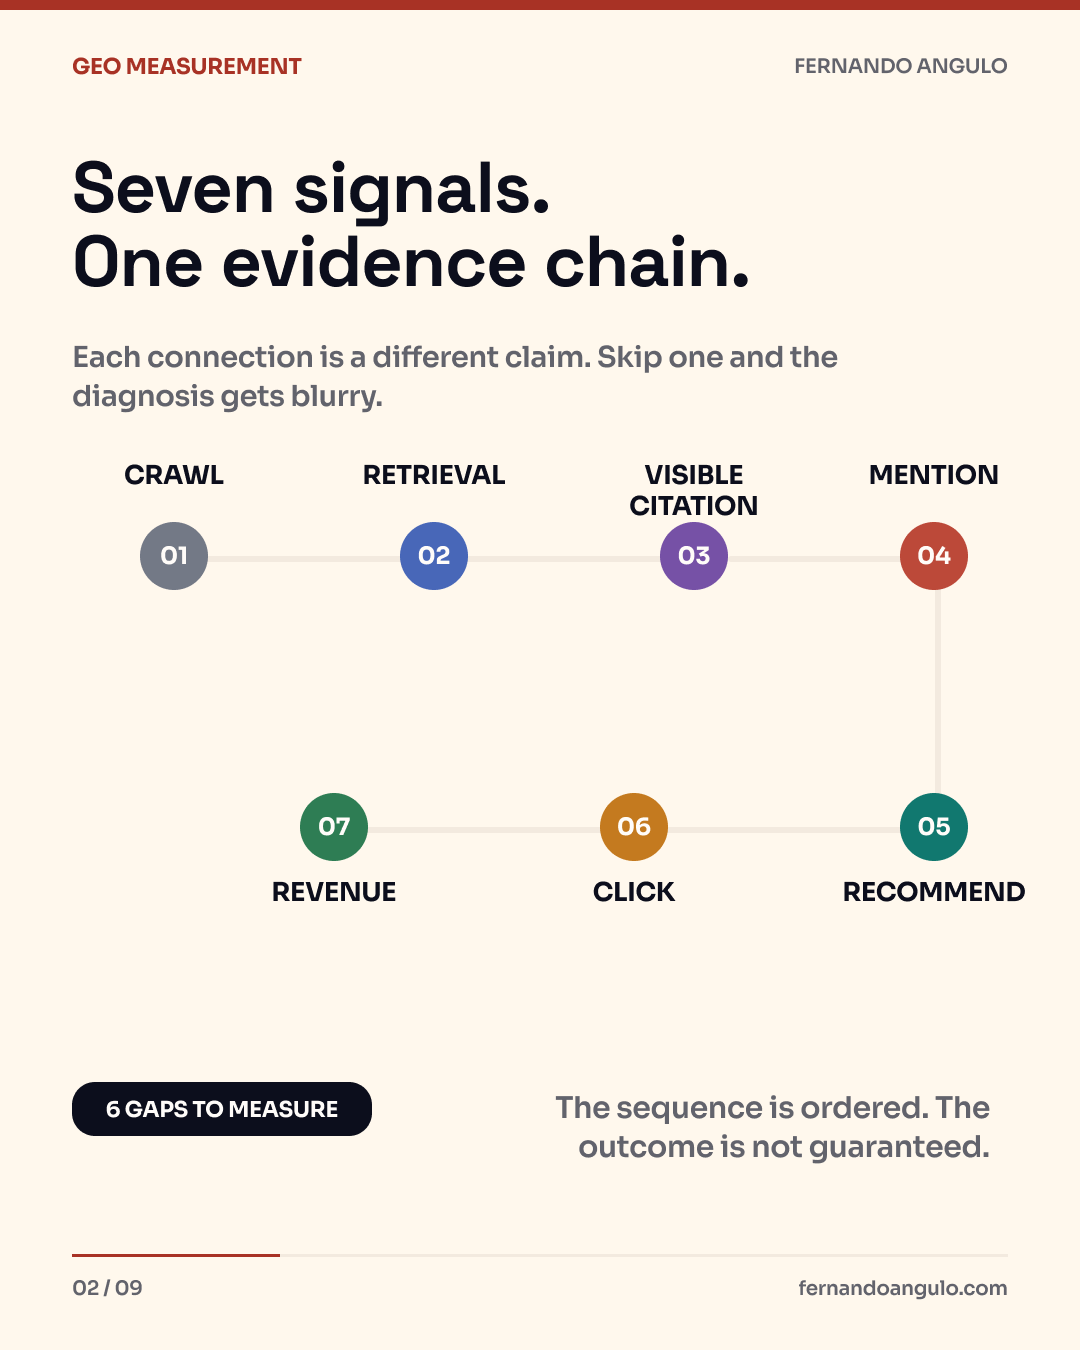
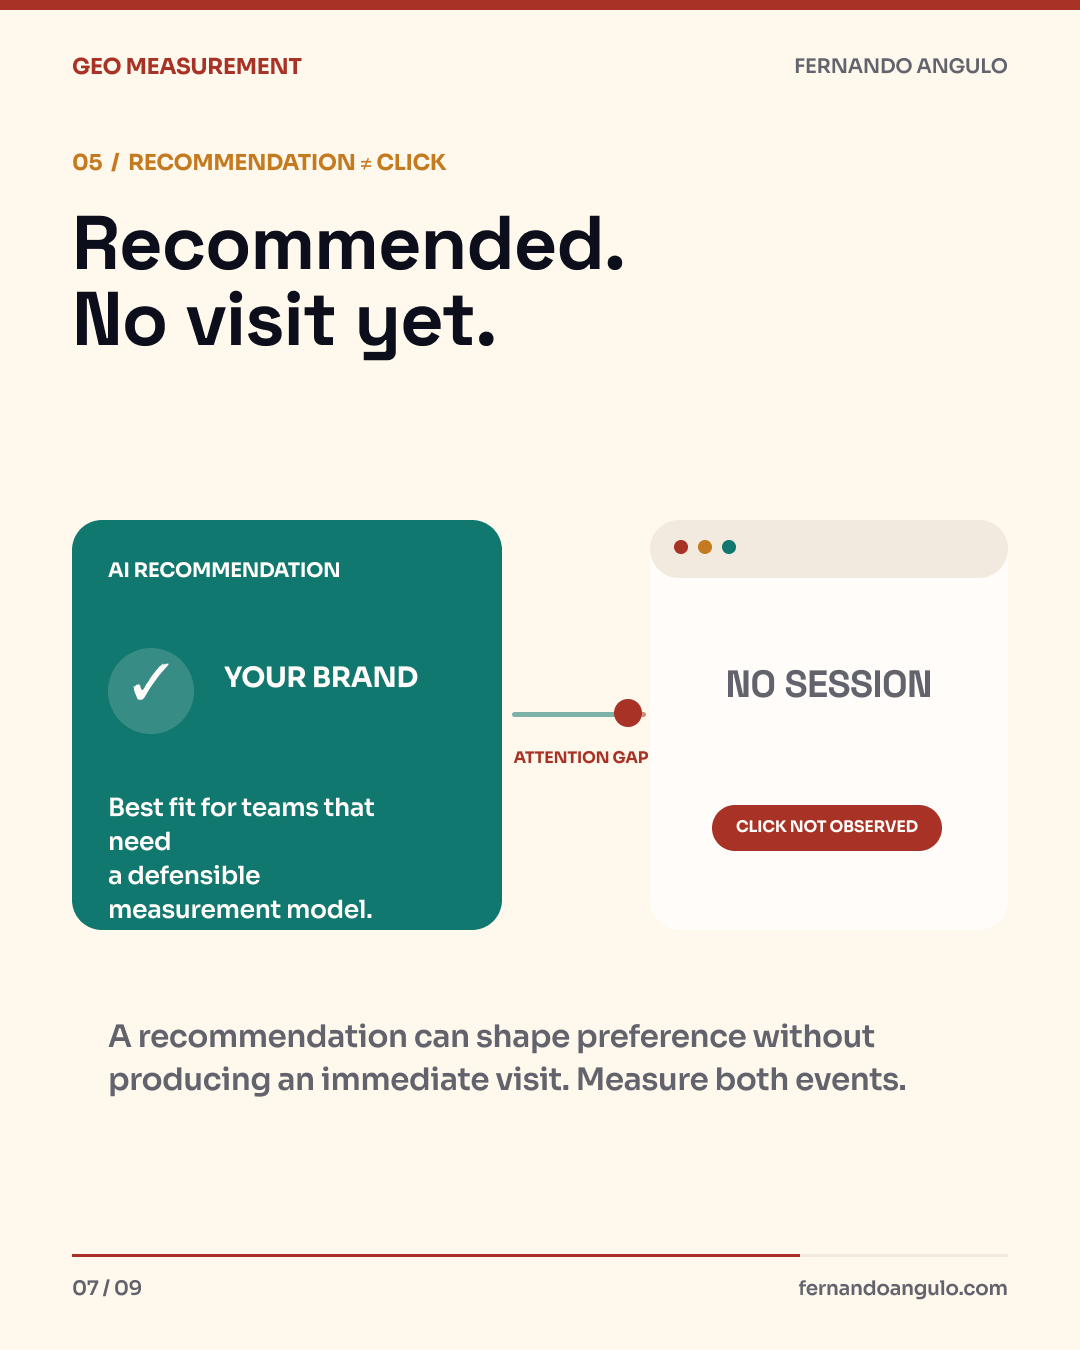
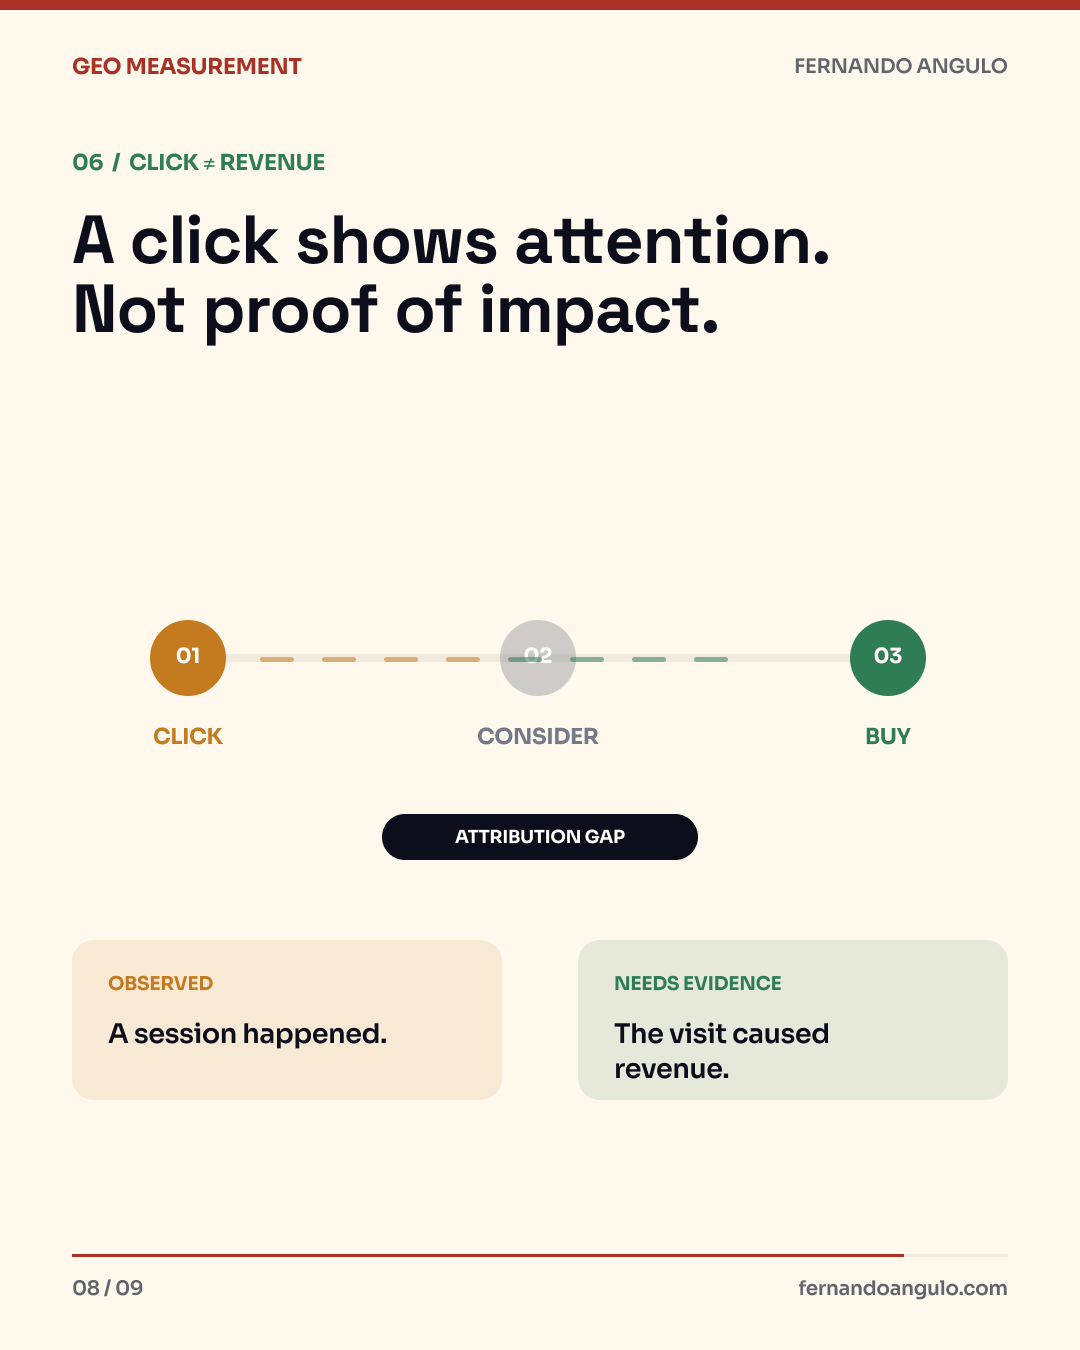
The non-equivalence chain keeps claims honest: crawl is not retrieval; retrieval is not citation; citation is not mention; mention is not recommendation; recommendation is not a click; a click is not incremental revenue. ChatGPT search responses can include citations and a sources panel, while OpenAI warns that results can be incomplete or incorrect. Google likewise says its AI experiences may show supporting links and use multiple related searches. Neither description turns a visible link into evidence of the complete internal retrieval process.
The full measurement stack, tiered by how fast it moves
Two KPIs make a scoreboard, not a control system. To steer a campaign mid-flight you need the layers underneath, ordered here from fastest-moving (your levers) to slowest (the outcomes):
| Tier | What to track | Cadence | What it tells you |
|---|---|---|---|
| 1. Inputs | Pages improved, evidence added, contradictions fixed, relevant independent coverage | Per release | What the team actually shipped |
| 2. Visibility | Mention share and citation share, segmented by platform and intent | Each observation window | What appeared in the tracked answers |
| 3. Engagement | AI-referred sessions, branded-search trend, direct traffic, lead-source answers | Monthly | Whether visibility coincided with human attention |
| 4. Business contribution | Assisted leads, opportunities and pipeline with documented AI-search touchpoints | Quarterly | What contribution is plausible without claiming causality |
Aggarwal and colleagues reported up to 40% source-visibility improvements in a controlled GEO evaluation. That experiment did not validate current-platform outcomes or this measurement framework. Treat these as practices to evaluate.
The monthly panel method (start this week)
You do not need enterprise tooling to start, but you do need a reproducible protocol:
1. Build the question set. Use real category, problem, comparison, supplier and decision questions from customer research. Twenty prompts can be a manageable starting point, not a universal standard.
2. Freeze the test conditions. Record the exact prompt, platform, date, market, language, device or interface, login state and any personalization that cannot be removed.
3. Repeat observations. Generated answers vary. Run each prompt more than once, ideally in a fresh context, and keep the repetitions visible rather than collapsing them into one anecdote.
4. Code the answer consistently. Capture brand mentioned yes/no, tracked domain cited yes/no, cited URL, prominence, competing brands, competing sources and material factual errors. Mark failed or unavailable responses as invalid so they do not distort the denominator.
5. Segment before comparing. Keep ChatGPT, Gemini, AI Mode and AI Overviews separate. Compare like with like across periods. If the panel or testing conditions change, start a new baseline.
| Field | Example | Why it matters |
|---|---|---|
| Prompt intent | Category comparison | Prevents one intent from dominating the result. |
| Test context | US, English, fresh session | Makes later comparisons interpretable. |
| Visibility | Mention: yes; citation: no | Separates narrative presence from owned-source presence. |
| Source class | Independent publisher | Shows whether the evidence came from owned, employer, organizer or independent sources. |
| Accuracy | Role current; statistic outdated | Visibility without accuracy can create brand risk. |
A client-ready GEO report fits into six slides
A useful report does not end with “we gained five points.” It ends with a decision. Keep the operational detail in an appendix and use these six slides in the meeting:
- Executive decision. What changed, why it matters and what you recommend doing next. One sentence for each answer.
- Scope and method. Platforms, market, language, period, prompt count, repetitions and methodology changes. Without this context, the comparison is not defensible.
- Visibility scoreboard. Mention share, citation share and recommendation rate, segmented by platform and intent. Include change from baseline and the denominator.
- Evidence map. Cited URLs, third-party sources, competitors, URL coverage and concentration. If nearly every citation depends on one page, visibility is fragile even when the total rises.
- Business signals. AI Overviews and AI Mode impressions, AI Assistant sessions and conversions, branded demand, lead-source answers and assisted pipeline. Keep each signal separate.
- Next experiment. One hypothesis, one action, one owner, one date and one decision criterion.
Secondary KPIs turn the scoreboard into a diagnosis. Recommendation rate is valid responses that place the brand in a predefined recommendation or shortlist ÷ all valid responses × 100. Owned support rate is responses that mention the brand and cite its domain ÷ responses that mention the brand × 100. URL coverage counts how many distinct owned pages earn citations; concentration shows the share captured by the top three. Add a representation accuracy review: accurate, partly accurate or materially wrong.
For Google, the Generative AI performance report in Search Console adds AI Overviews and AI Mode impressions by page, country, device and date when sufficient data is available. In Google Analytics, the default AI Assistant channel groups sessions from assistants such as ChatGPT, Gemini, DeepSeek, Copilot and Grok, but excludes AI Overviews and AI Mode. Do not add the two as though they measured the same journey.
Reporting GEO to a CFO without hand-waving
The board question is not “what is our citation share?” It is “what decision does this evidence support?” Use a contribution chain: visibility changed, qualified visits or branded demand moved, and assisted opportunities changed. None of those steps proves the previous one caused the next. Branded search and direct traffic are especially multicausal.
Google's Generative AI performance report improves the evidence for AI Overviews and AI Mode by showing impressions by page, country, device and date when sufficient data is available. It still does not provide complete query, click or revenue attribution. Pair it with analytics, lead-source questions and qualitative sales evidence, and label each signal for what it is.
The strongest answer is not another score. It is a better decision. State what you observed, which explanation is plausible, where the inference stops and which experiment will reduce uncertainty in the next period.
Frequently Asked Questions
Use a fixed prompt panel and calculate two rates by platform: mention share equals valid responses naming the brand divided by all valid responses; citation share equals valid responses citing the tracked domain divided by all valid responses. Record the denominator and test conditions, repeat observations, and connect visibility to traffic and pipeline only as contributing evidence.
Report four separate layers: inputs shipped; mention share and citation share by platform and intent; engagement such as AI-referred sessions, branded-search trend and lead-source answers; and business contribution through assisted leads, opportunities and pipeline. Keeping the layers separate prevents visibility from being misreported as revenue attribution.
Semrush reported that 45% of surveyed marketing leaders could not accurately measure brand visibility in AI-generated answers, while only 9% said they had tools to track all relevant metrics across platforms. Common causes include changing prompts, blended platform data, missing denominators and incomplete attribution.
Build a contribution chain: citation visibility, AI-referred sessions or branded demand, then assisted pipeline. Report whether those signals moved together without assuming that one caused the next. Referral data undercounts exposure, so pair analytics with lead-source questions and qualitative sales evidence.
Monthly is a practical starting cadence for many teams, not a universal rule. Keep the prompt set and test conditions stable, repeat observations, and increase the sample when answers vary too much for a decision. Start a new baseline whenever the panel or method changes materially.
No. A visible citation proves that the interface displayed a reference or link. A retrieved URL describes an internal step that can only be claimed when the platform or tool exposes that trace. A crawler request in server logs also does not prove retrieval, citation, mention or recommendation.
Need this measurement framework in front of your leadership team?
I speak at 50+ events a year on AI search and GEO, including “Mentions vs Citations: The Two Metrics Every CMO Conflates,” built on the 126M-prompt dataset behind this piece.
Sources checked in this revision
AI features and your website, Google · Generative AI performance reporting · AI Assistant channel in Google Analytics · Search and sources in ChatGPT · Semrush AI Visibility Index, June 2026
Data update: September 2026
Google states that its worldwide Generative AI performance report rollout completed on 31 August 2026. It includes AI Overviews and AI Mode impressions by page, country, device and date. It does not provide full query, click or revenue attribution; sufficient impressions are also required.
Read the source and methodology